Machine learns by loss function. The Loss function is a method of assessing how accurately algorithm models the given data. Optimization problem use loss functions for minimizing errors. One of the most widely used losses functions is Mean Squared Error (MSE) and Minimum Absolute Error (MAE).
In this article, we’ll see these two loss functions in detail. Whenever you use a linear regression model, internally it gives a mathematical formula –
y = b + cx
You must know all the b, c, and x values to know the value of y. In case you don’t know any of them, generally, we use the hit and trial method and keep on putting the values of X for getting the values of b and c. Linear Regression is an estimator or algorithm, which is used to find all these 4 values.
How the model finds the value of b and c internally?
We have 2 terms y and y-hat, where y represents the observed data or expected prediction, and y-hat represents the actual prediction for a line of best fit in Linear Regression. Further, we use these two terms to differentiate between the predicted data (y-hat) and the observed data (y).
Suppose, y = 80 and y-hat = 65
Difference between these two values i.e, 80 – 65 = 15
This shows us the value of error i.e, 15 is the calculated error. Lesser the error, better is the value of b, and c ultimately better is our model.
For a single input, we get lots of outputs as per the conditions but the average path which shows a linear relationship i.e, y = b + cx is known as the best fitting line in Machine Learning. If you have to find a line that is in such a way where you’ll get the minimum error in all the points, then we add all the errors and find an average of it.
Minimum Absolute Error (MAE)
The Machine internally creates a line which uses the error formula. It keeps on adding the formula Σ(y – y-hat), which continuously creates the lines. Wherever there are minimum errors they display the line. b is the one who decides from where the line will begin whereas, the correct line is decided by the slope c. This concept of finding a minimum error is called Minimum absolute error. It also converts the negative value to positive values and forms as –
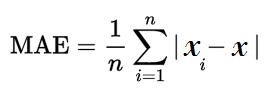
Where n is the number of errors, Σ is the summation symbol which adds all the absolute error. Thus, the Minimum Absolute Error leads to the best prediction line. After getting the values of the dataset and performing lots of calculations internally, the model decides the MAE. Thus, we get the values of b and c.
Mean Squared Error (MSE)
For knowing the error we used MAE, but sometimes it does not give better results. Hence, we use the Mean Squared Error (MSE). In Linear Regression, to find the continuous value of model i.e y = b + cx, we need to know the value of b and c. In this case, MSE is 90% effective whereas, chances of getting better values are 10% for MAE. The fit( ) function behind the scene uses MSE to find a minimum error.
For example –
y = 80 and y-hat = 65
Difference between these two values i.e, 80 – 65 = 15
In MSE, it squares the value 15 i.e, 15 * 15 = 225
In Machine learning, we use term loss for errors. Similarly in Deep Learning, some optimizers help in minimizing errors. In Multi-Linear Regression, the same functions are used with a different approach.
Let’s see the practical approach of these functions using an ideal use-case,
In this dataset, input ‘x’ given is the year of experience and ‘y’ shows the salary based on years of experience. After we train the model, in the future it will predict the salary by knowing the years of experience. Suppose you are a fresher, who has zero experience, but still you will get salary as per the company’s guidelines. The Model uses the formula of y = b + cx, thus whatever is the value of b, that amount will be your initial salary.

After importing the pandas library, we have loaded a dataset. The head( ) function is used to get the first n rows. info( ) function shows us all the information related to the dataset.

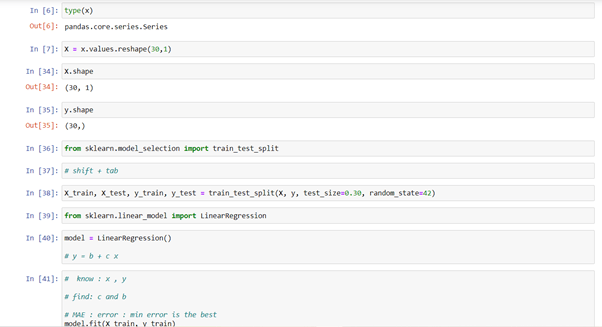
type( ) function tells us the class type of the arguments passed as parameters. For giving a new shape to an array without modifying data, we use reshape( ) function. Our model is Linear Regression, we will fit the train data into it.
The only way to check whether the model is trained or not is testing. While training data, we don’t give entire data for training and keeps the rest of the data as testing data to match the results. train_test_split is a function in Sklearn model selection, which is used to split data into training data and testing data.
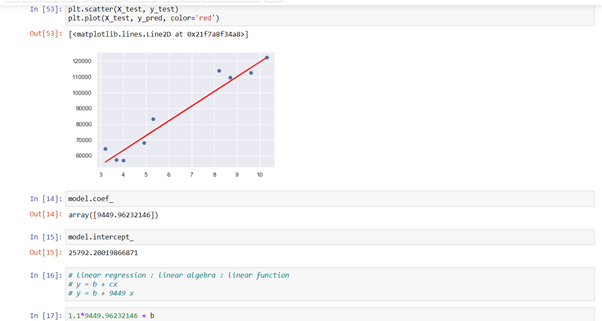
predict( ) function predicts the value ‘y’ of the new set of data. For getting scatter graph, we use plt.scatter( ) function. We give the value of our testing data and it creates the best fit line as per the formula. y_test gives the real answer and y_predict gives us the predicted answer.
In the Machine Learning world, testing is very important for finding the error. For better prediction, we need to find good features. Here, feature selection comes into play. We don’t have multiple features in our dataset, but in case of big data, where we have lots of features, without feature selection it’s impossible to predict anything.

coef_ function gives the coefficient for the prediction of each of the targets or values you want to predict. intercept_ gives the value of b.
We’ve used the sklearn metrics module. It implements several loss, score, and utility functions to measure classification performance. mean_absolute_error function and mean_sqaured_error function are the loss functions that estimate the error from the model.

After your model is fully trained, you can create an app or software using this model. joblib function saves the model. matplotlib.pyplot is a group of command style functions that make some kind of changes in figure and creates a plotting area in figure. We can use more commands for creating figures, plotting lines in the plotting area, decorating plot with labels. Seaborn is a library for making statistical graphs in python. sns.set( ) is default seaborn theme, scaling and colour palette.

This was a basic overview of how loss functions work in Machine Learning and how important it is for creating a model. Thank you for reading. I Hope you liked the content.

Very insightful article. Would be interested to see the consequences of loss function breakdown, or in other words, forgetfulness in the network
LikeLike
Thank you and I’m also a student, learning machine learning from past few weeks. I will definitely go through this topics.
LikeLike